Experiments
Moon Shadow
Throughout 2021, teachers Unterman and Valsamis, and mentor Adams developed a new experiment to attempt to measure the shadow of the moon in muons at the earth’s surface. Teachers and their student-teams designed and built two support frame prototypes for our cosmic ray telescopes. Unterman’s team collected preliminary data. One of the largest uncertainty in upper limits of muons coming from the sun determined in our 2017 eclipse project is the location of the shadow, since no astronomy group has reported an observation at low energy. If the shadow can be observed, it will allow us to improve our measurement during the next eclipse in the U.S. in 2024.
MUSE
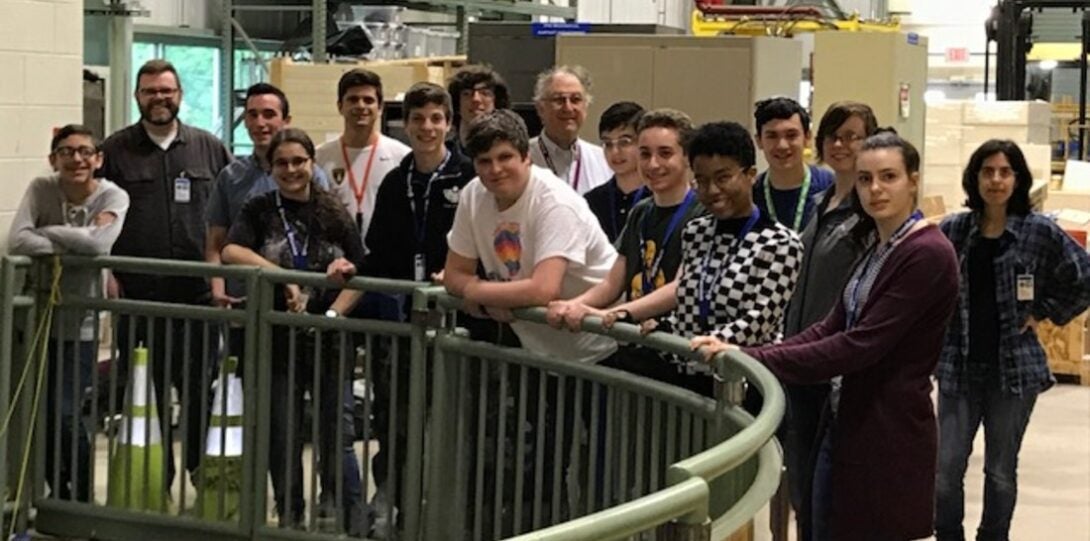
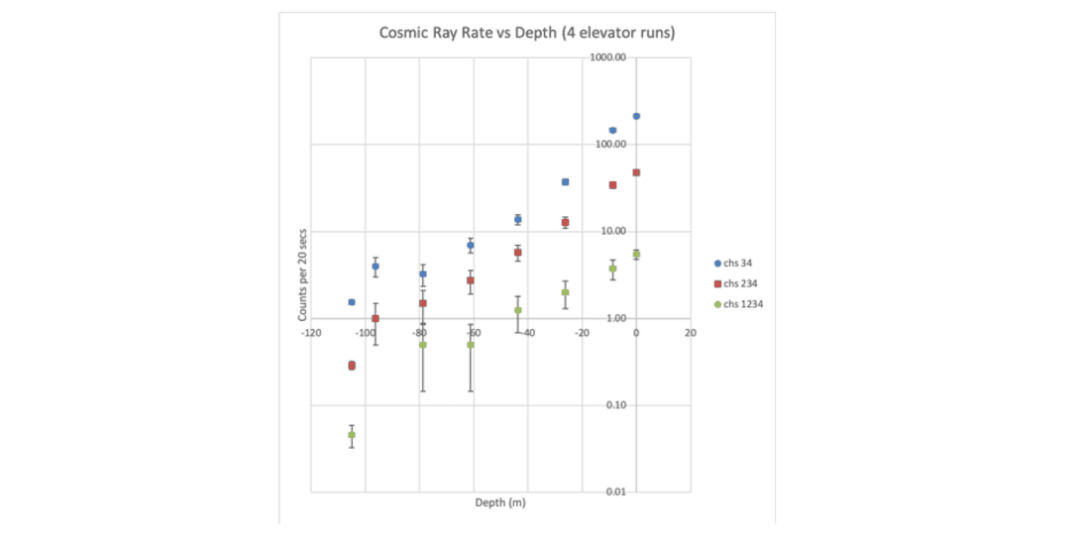
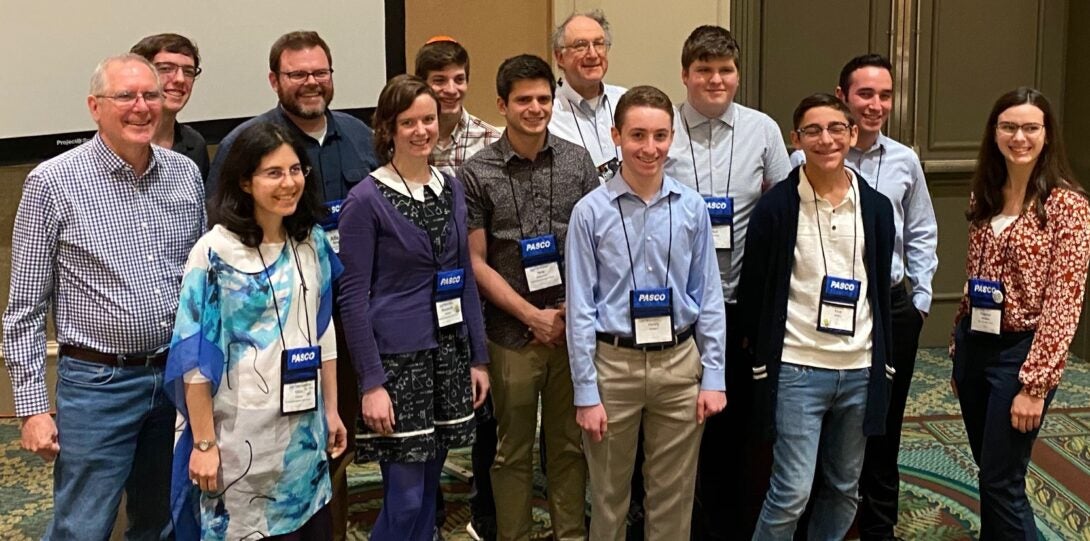
Throughout 2019, six schools carried out an experiment at Fermilab to measure cosmic ray rates in the MINOS tunnel 105m underground as a function of distance from the access shaft. A proposal was submitted in December 2018, approved in March 2019, and data-taking took place from March through May 2019. Preparation began during the 2018 summer workshop where muon rates were studied as a function of overburden. Students decided to develop a proposal during the fall and to submit TSW-1548 to Fermilab before winter break. Cosmic Ray Fellow Nate Unterman serves as spokesperson. Prototypes were developed during the winter. Analysis was carried out during several meetings May through August. Initial results were reviewed at the July summer workshop and presented at the International Cosmic Ray Conference in Madison in July. Final results were presented by teachers and students at the AAPT conference in Orlando Jan. 2020. Participants were also excited to observe neutrino interactions with their detectors in the MINOS tunnel. Results from a secondary goal of measuring cosmic ray rates versus depth is shown below, along with photos of collaboration members.
Muon Lifetime
With only one scintillation detector and the QuarkNet DAQ board, we can measure the lifetime of the fundamental particle, the muon. The muon only lives approximately 2 microseconds. Our detector was specifically designed to trigger on a muon and then wait 25 microseconds to record the next pulse coming from the detector. Most muons will have decayed by that time. We use the same apparatus to see the muons decay product. The muon decays into an electron and two neutrinos. The two neutrinos escape our apparatus and interact so little that they will go directly through the Earth without stopping. The electron is charged and will give off light going through the scintillator.
We must have patience. Ten muons per second go through our detector, but in order to see them decay, they must stop inside our detector. Most muons have so much energy that they go through. However only 1 muon out of every thousand lose enough energy to stop and decay inside our scintillator. We made our scintillator extremely thick (3 inches) to maximize the number of stopping muons. We can improve the rate of stopping by adding dense shielding above our detectors so the muon first loses energy and slows down in the steel or lead. In fact, the UIC detector is located on the second floor of a 4-story building so there is quite a bit of concrete and steel above the detector that already slows down the muons.
How can we tell the difference between a muon pulse and an electron pulse in the scintillator? All charged particles create light in the scintillators. The pulses from muons and electrons are slightly different in size, but we ignore that effect and use the timing information. Obviously the electron appears after the muon pulse. As long as there are very few other pulses, the next pulse after the trigger belongs to the electron. That’s it! We plot the time between trigger and second pulse and find an exponential distribution with characteristic time of approximately 2 microseconds.
The rate of muon decays versus time is shown for two definitions of incoming muons. The slope of the rate on a log plot gives the lifetime of the muon. The plot on the right requires a cleaner muon definition and the flat horizontal tail is suppressed.
In an newer effort at UIC (CHAMP search) presented at the 2010 APS meeting, the muon time is shown for muons that stop.
Distribution of Cosmic Rays
We can measure the direction of the muons that reach the Earth’s surface. We need two counters. If we require both counters to fire at the same time, the path of the muon must have gone through both detectors. Therefore we know approximately what direction the muons came from, by measuring the rate of muons as a function of the angle of the two detectors with respect to the vertical.
It is much harder to tell the difference between upward going and downward traveling muons. It turns out that almost all muons are coming from the upper atmosphere and very few come from, or through, the Earth. But to measure that ourselves, we must be able to define a coincidence over a short enough time so that hits from the top and then the bottom counter are in coincidence but if the hits appear on the bottom and then on the top, we exclude them. The muons move at near the speed of light (3×10⁸ m/s), so if the counters are 30 cm apart, the time between the two hit is Dt = distance/speed = 0.3m/(3×108 m/s) = 1×10⁻⁹s. The muon pulses can not be located in time better than a few ns (ns = 10-9s). So this is hard! We could not accomplish this with the first version of the DAQ card (DAQ1). But a second version DAQ2 was designed at Fermi and University of Washington with better time capability, that has become the standard QuarkNet readout card throughout the world.
Time Dilation.
Verified Einstein’s Time Dilation with a field trip with several of our detectors to the top of the Sears Tower! A talk given at Argonne National Lab describes our trip and the results on time dilation.
Figure below shows the rate of cosmic rays on the roof of the Sears Tower (Yes, Sears not Willis!) as a function of Pb shielding. It is compared to the same measurement on the ground without shielding. The shielding compensates for muon energy loss in the extra 300m of air that lies between the roof and ground locations. The result is that the rates agree to within 4%, whereas we expect 52% of the muons to decay before reaching the ground, if there is no effect of time dilation predicted by Einstein. Einstein wins this one!
Identify Photons and Electrons in Cosmic Rays.
As part of the Large Array experiments we commissioned a detector of Pb glass (like Waterford crystal) to identify the electron and photon components in cosmic rays at the Earth’s surface. The Pb-glass does not scintillate, but it is sensitive to Cerenkov radiation given off by particles traveling faster than the speed of light in glass. This is the light equivalent of a sonic boom where sound waves build up because an object is moving faster than sound in the air. The Pb-glass was loaned to us from an experiment at Fermilab that measured proton-antiproton annihilation.
Special Distribution of Muons in Air Showers.
A Large Array experiment consisting of 24 scintillation counters was commissioned in order to measure the number of muons in cosmic rays at the Earth’s surface. Six separate DAQ streams were required since each QuarkNet DAQ card has a maximum of 4 input channels. DAQ and detectors were gathered from many schools and brought to UIC during our 2006 workshop. Data was collected for 3 weeks, however only a 2-hr period was analyzed using UIC code, followed by hand scanning and building of 20-detector events from separated data streams that fired at the same time. One set of detectors were commissioned with too low HV and were therefore inefficient for detecting muons.
Our plan is to correlate the 6 separate streams for the entire data set, but the muon multiplicity extracted from a 2-hr data sample is shown. Corrections have been applied for the trigger bias, which is complex. One of our graduating QuarkNet high school students wrote a program during his first semester in college, to estimate the true number of hits, given the number observed, under the assumption that all detectors were efficient at detecting muons at the same rate, by modeling the affect of triggering requirements (at least 2 hits per 4-counter array). For example, our 20-counter detector would trigger and record data with 4 hit counters, where 2 counters hit array A and 2 counters hit array B, but would not record events where 3 counters hit A and 1 counter hit array B, because the B array trigger would not have been satisfied.
The number of times N of the 16 counters were hit simultaneously, is presented as a function of N (blue diamonds). It is compared with data from an earlier test in the Barn at Fermilab (circles). The fairly flat distribution at high multiplicity demonstrates that some cosmic ray air showers contain many muons.
Speed of Cosmic ray Muons
Cosmic ray detectors were separated vertically by several meters and the arrival time of the muon at each detector was used to measure the speed of the muon. During the 2007 workshop, students from Gwendolyn Brooks High School measure the speed of the muon to be 2.91m/s = 0.98c with a statistical error of 5%, where c is the speed of light c= 2.998m/s) Speed of cosmic ray muons workshop. After the 2008 workshop, students from Glenbrook South High School repeated the experiment with detectors at their school, paying special attention to systematic errors, and was able to improve the measurement of the speed of the muon to be 0.997c+-0.004c. They published in the Journal of the Illinois Science Teachers Association:Measurement of Ultimate Speed: A High School Experience.


